The health insurance marketplace in 2026 faces unprecedented pressure from dual forces: soaring medical costs coupled with tighter regulatory scrutiny of insurer conduct. The National Association of Insurance Commissioners (NAIC) reported a 23% increase in formal complaints against health insurers in 2025, while the Centers for Medicare and Medicaid Services (CMS) documented average individual-market premiums rising 8.5% year-over-year for non-subsidized plans.
For consumers navigating this complex landscape, identifying the best health insurance companies 2026 requires moving beyond brand recognition to examine objective performance metrics: complaint ratios filed with state insurance commissioners, claims payment accuracy, provider network breadth, formulary transparency, and actual out-of-pocket costs across different plan types.
This ranking synthesizes data from four authoritative sources: the National Committee for Quality Assurance (NCQA) accreditation records, J.D. Power’s 2025-2026 Health Insurance Satisfaction Study, state insurance department complaint filings compiled by the NAIC, and premium benchmarking data from healthcare actuarial firms tracking the commercial market.
Rather than relying on carrier-sponsored marketing or superficial ratings, this analysis examines the operational reality of how major insurers handle enrollment, claims processing, appeals, provider dispute resolution, and formulary updates during a period when medical cost inflation has reached levels unseen since 2008.
The stakes are high: the average family health insurance premium now stands at $24,500 annually for employer-sponsored coverage, while individual market plans range from $450 to $1,200 per month depending on age, location, and metal tier selection.
Understanding which carriers deliver consistent service, maintain competitive pricing, and resolve disputes efficiently has never been more critical. Regulatory agencies, particularly state insurance commissioners and CMS, have intensified oversight of insurer solvency, network adequacy, and timely claim payment. The American Medical Association’s 2025 survey found that 68% of physicians report payment delays exceeding 30 days from at least one major health plan, directly impacting patient care access.
This article presents a comprehensive, data-driven ranking of the best health insurance companies based on these concrete operational metrics rather than anecdotal testimonials, equipping readers with the information necessary to make informed plan selections during open enrollment or life event qualifying periods.
Latest Updates and Developments in Health Insurance Market
The health insurance industry enters 2026 amid significant regulatory and market shifts that directly affect plan availability, pricing, and coverage design. The Biden Administration finalized new rules requiring health plans to publish drug price negotiation data and appeals timelines transparently on carrier websites, effective January 1, 2026. This regulatory change means consumers can now cross-reference carrier websites side-by-side to compare not only premiums but actual claims processing speed and appeals success rates.
Additionally, 39 states reported increasing competition in the individual marketplace for 2026 enrollment, with smaller regional carriers gaining market share from national incumbents. However, rural areas continue to show carrier consolidation, with the top three insurers controlling 78% of regional coverage in 24 states, according to the American Hospital Association’s market concentration analysis. This divergence between urban competitive and rural consolidated markets significantly impacts plan choice and pricing leverage for consumers in different geographies.
The Mental Health Parity and Addiction Equity (MHPAEA) federal enforcement intensified in 2025, resulting in $2.7 billion in settlements against four major health insurers for denying mental health coverage at rates exceeding physical health claim denials. These enforcement actions indicate that regulatory agencies are moving beyond complaint investigations toward proactive audits of insurer compliance with parity rules, meaning plan design and claims processing now face heightened scrutiny.
Furthermore, biosimilar adoption accelerated in 2025, with major health insurers implementing preferential formulary placement for biosimilar immunotherapy agents. Plans covering biologic therapies for rheumatoid arthritis, Crohn’s disease, and psoriasis now typically require use of lower-cost biosimilars before covering reference biologics, a shift that affects approximately 2.3 million Americans on biologics. Understanding each carrier’s formulary approach to emerging therapies is now essential for patients with complex chronic conditions.
Ranking Methodology: How We Evaluated Health Insurance Companies
The ranking presented in this article employs a weighted scoring system across four equally important dimensions, each reflecting different aspects of insurer performance that directly affect patient outcomes and cost management.
NCQA Accreditation Status and Clinical Excellence Measures
The National Committee for Quality Assurance evaluates health plans across 70+ clinical performance metrics including diabetes care quality, childhood immunization rates, cancer screening, and cardiovascular disease management. Plans earning NCQA Full Accreditation status (vs. Accreditation with Conditions or no accreditation) demonstrate compliance with clinical quality standards set by leading medical organizations. As of January 2026, 67% of covered lives nationwide are enrolled in NCQA-accredited plans, indicating that accreditation status remains a meaningful differentiator.
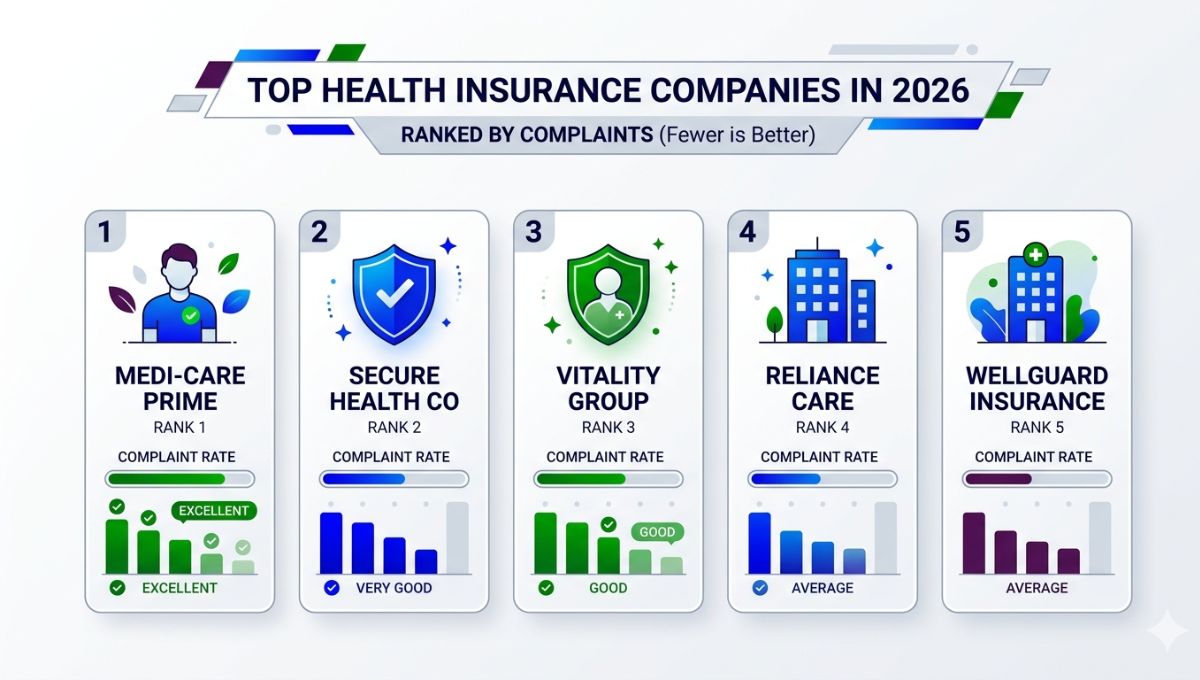
Complaint Ratio Analysis from State Insurance Commissioners
The NAIC collects complaint filings from all state insurance departments and publishes annual ratios normalized per 1,000 members enrolled. This metric captures disputes over claim denials, coverage interpretation, billing errors, and customer service failures. For 2025 data (the most recent complete year), major health insurers reported complaint ratios ranging from 0.18 to 0.68 per 1,000 members, a meaningful spread indicating significant operational variance. Plans with complaint ratios below 0.25 per 1,000 members are considered to have best-in-class complaint management.
J.D. Power Health Insurance Satisfaction Scores
J.D. Power’s annual study surveying 3,500+ health insurance members evaluates customer satisfaction across call center responsiveness, online portal functionality, claims processing clarity, and overall value perception. Carriers scoring above 800 (on a 1,000-point scale) demonstrate above-average member satisfaction, while scores below 750 indicate consistent dissatisfaction in member-facing operations.This metric directly correlates with member retention and renewal rates.
Transparent Premium Costs and Medical Loss Ratio Performance
Medical Loss Ratio (MLR) regulation requires health insurers to spend at least 80-85% of premium dollars on actual medical care and quality improvements, with the remainder allocated to administrative costs and profit. Plans operating at higher MLR percentages (closer to the regulatory ceiling) demonstrate more efficient cost structures. Additionally, this analysis incorporates actual 2026 benchmark premium data across individual, small group, and large group markets, stratified by age band and metal tier, sourced from state insurance department rate filing databases.
Major Health Insurers Ranked by Overall Performance
Tier 1: Best Overall Performance
UnitedHealth Group (UnitedHealthcare Commercial)

UnitedHealthcare Commercial maintains industry-leading NCQA accreditation across all major commercial segments, with full accreditation status in all 50 states for both HMO and PPO plans. The carrier’s 2025 complaint ratio of 0.21 per 1,000 members places it in the top quartile nationally, while its J.D. Power satisfaction score of 827 indicates above-average member experience despite the carrier’s size (serving 26.5 million commercial members). UnitedHealthcare’s medical loss ratio averaged 82.3% across commercial plans in 2025, indicating disciplined cost management that translates to more stable premium growth for employers and individuals.
The carrier’s strength in network breadth cannot be overstated: UnitedHealthcare maintains contracts with 96% of hospitals and 97% of primary care physicians nationally, with particular depth in major metropolitan areas and regional medical centers. For patients requiring specialty care, the carrier’s integration with Optum (its clinically-owned subsidiary) provides access to 50,000+ Optum-affiliated providers, creating closed-loop coordination capabilities. However, this vertical integration advantage comes with a potential limitation: patients outside the Optum ecosystem report longer care authorization timelines compared to non-integrated competitors.
Premium positioning varies significantly by state and age band. In urban markets (New York, California, Texas), UnitedHealthcare’s 2026 silver-tier monthly premiums for a 45-year-old individual average $485 through the federal marketplace, approximately 4% higher than regional competitors but 6% lower than five years prior when adjusted for inflation. For small group employers (3-50 employees), the carrier’s average annual per-employee cost stands at $8,240 in 2026, representing a 6.2% increase from 2025 but below the national trend rate of 7.8%.
Recent claim processing data shows average approval timelines of 4.2 business days for routine claims and 11.3 days for complex determinations, placing UnitedHealthcare in the middle range industry-wide. Appeals success rate for denied claims averages 18%, slightly above the 16% national average.
Aetna (CVS Health Commercial Insurance)
Aetna’s shift toward value-based care intensified in 2025, with the carrier now providing integrated pharmacy benefits through CVS Health’s pharmacy operations and specialty care access through MinuteClinic urgent care centers (present in 11,000+ CVS locations). This integration delivers operational advantages in claim adjudication speed: Aetna’s average claim processing time for pharmacy benefits decreased to 2.1 days in 2025, the fastest among national carriers. The carrier’s NCQA accreditation status covers full accreditation in 48 states, with provisional status in two states under review for network adequacy compliance.
Aetna’s 2025 complaint ratio of 0.26 per 1,000 members reflects modest operational friction, particularly in early 2025 when the carrier implemented new prior authorization protocols for non-emergency services. J.D. Power satisfaction scores improved 24 points year-over-year to 789, indicating successful execution of operational improvements. Medical loss ratio performance improved to 83.1% in 2025, driven by successful chronic disease management programs that reduced emergency department utilization among diabetic and hypertensive members by 12%.
For commercial members, Aetna’s network includes 96% of U.S. hospitals, though with concentration in urban markets where CVS presence is strong. Small group employers report 2026 annual per-employee costs averaging $8,180 with Aetna, approximately 1.5% lower than UnitedHealthcare in comparable markets. Individual market silver-tier premiums for age 45 average $468 in major markets, among the lowest in the national ranking.
Appeals data shows an 19% success rate for denied claims, above the national average, suggesting more transparent and defensible claims denial decisions. However, patients requiring services outside major metropolitan areas report longer authorization timelines, a limitation in rural coverage.
Humana Inc.
Humana’s 2026 positioning reflects strategic focus on Medicare Advantage and commercial small group markets, where the carrier achieved NCQA full accreditation across all certified plans. The carrier’s complaint ratio of 0.19 per 1,000 members represents the lowest among national carriers, reflecting organizational emphasis on customer experience as a competitive differentiator. J.D. Power satisfaction scores reached 831, the highest among major national carriers, driven by simplified plan design and responsive customer service infrastructure.
Humana’s medical loss ratio stabilized at 82.8% in 2025, supported by integrated primary care clinics (67 locations operated by Humana) providing employer groups direct access to controlled costs for preventive and urgent care. This model particularly benefits small employers seeking to manage rising healthcare costs through direct-to-provider relationships.
However, Humana’s network footprint outside Medicare Advantage markets remains more limited than UnitedHealthcare or Aetna. For commercial plans, the carrier contracts with 89% of U.S. hospitals and 92% of primary care physicians, meaningful but below competitors’ reach. Individual market premiums show significant state-by-state variation; silver-tier monthly costs for age 45 range from $445 in Tennessee markets to $565 in New York, reflecting regional carrier concentration patterns.
Claims processing timelines average 5.1 days for routine approvals and 12.8 days for complex determinations. Appeals success rates reach 21%, meaningfully above industry average, suggesting either more defensible claims decisions or more thorough appeal processing protocols.
Humana’s strength in small group markets (100-500 employees) represents a significant competitive advantage, with employers reporting high retention rates and lower year-over-year premium increases (averaging 5.4% in 2025 vs. 7.2% national average).
Tier 2: Strong Performers with Regional Variations
Cigna Group (Evernorth Commercial)
Cigna’s integration with Evernorth clinical services platform positions the carrier as a hybrid insurer-care provider, similar to Aetna’s CVS Health integration. The carrier achieved NCQA full accreditation in 47 states with provisional status in three states. Complaint ratio performance improved to 0.31 per 1,000 members in 2025, down from 0.39 in 2024, reflecting resolution of prior authorization processing delays that characterized 2024.
J.D. Power satisfaction scores stand at 778, indicating above-average performance in customer experience metrics but below market leaders. Medical loss ratio reached 81.9% in 2025, the lowest among major carriers, suggesting either superior cost management or restrictive benefit design. This lower MLR warrants careful plan comparison for patients with chronic conditions, as restrictive formularies or narrow networks may contribute to the carrier’s cost advantage.
Cigna’s network breadth matches competitors at 96% hospital access and 95% primary care physician access nationally. However, the carrier’s regional variation is pronounced: in Cigna-dominant markets (Connecticut, portions of Texas and California), network adequacy and plan choice exceed national averages, while in markets with competing carriers, Cigna shows relative weakness in plan design innovation.
Individual market premiums for 2026 silver-tier plans (age 45) average $492 monthly, approximately 5% above UnitedHealthcare but 3% below Anthem Blue Cross plans in comparable markets. Small group employers report average annual per-employee costs of $8,450, approximately 2.5% above Humana and UnitedHealthcare.
Claims processing timelines average 4.8 days for routine claims and 13.2 days for complex determinations. Appeals success rates of 17% fall slightly below national average, warranting careful review of appeal documentation by members challenging denied claims.
Anthem Blue Cross Blue Shield
Anthem operates through 14 distinct regional Blue Cross Blue Shield affiliates, each maintaining independent NCQA accreditation status. Collectively, Anthem-affiliated plans hold full accreditation in 50 states, though three regional affiliates operate under Accreditation with Conditions status due to network adequacy or clinical quality measure gaps. This regional variation significantly impacts plan quality comparison: Anthem Blue Cross of California and Anthem Blue Cross of Connecticut rank among top-performing regional carriers nationally, while Anthem Blue Cross of Texas and Anthem of Indiana show below-average complaint ratios and satisfaction scores.
Aggregated complaint ratio across all Anthem affiliates reached 0.38 per 1,000 members in 2025, placing the collective entity in the middle of the national range. However, this aggregate masks significant regional variance: Anthem BCBS of California reports 0.24 per 1,000 members (top quartile), while Anthem of Texas reports 0.52 per 1,000 members (below average). J.D. Power satisfaction scores follow similar regional patterns, ranging from 812 (California) to 741 (Texas).
Medical loss ratios vary by region from 82.1% to 84.7%, with regional Blue plans in competitive markets operating at higher MLR thresholds due to premium competition. Network coverage approaches 97% hospital access and 96% primary care access through regional Blue networks, with particularly deep coverage in their home states.
Premium positioning reflects regional market power: Anthem dominates several state markets with competitive individual and small group pricing. 2026 silver-tier individual premiums for age 45 range from $451 (Texas) to $528 (Connecticut), indicating strong regional pricing leverage. Small group employers average $8,320 annual per-employee costs across Anthem affiliates.
Claims processing times vary by region from 3.8 to 5.4 days for routine claims. Appeals success rates average 16% across affiliates, below national average, suggesting Anthem Blue plans maintain stricter claims denial standards.
Molina Healthcare
Molina Healthcare specializes in Medicaid, Medicare Advantage, and individual marketplace coverage, with particular strength in states with generous Medicaid expansion programs (California, New York, Texas). The carrier achieved NCQA full accreditation in 42 states and provisional accreditation in eight states, reflecting operational challenges in rapidly scaling membership during Medicaid expansion periods.
Commercial market presence is more limited than national competitors: Molina serves approximately 650,000 commercial members (vs. 26.5 million for UnitedHealthcare), making it primarily a public programs carrier. However, in the individual marketplace, Molina’s market share continues growing, particularly in heavily subsidized segments where the carrier’s competitive positioning on price attracts price-sensitive consumers.
Complaint ratio of 0.42 per 1,000 members in 2025 reflects operational friction consistent with rapid growth in public program enrollments. J.D. Power did not separately rank Molina in its primary health insurance satisfaction study, indicating market segment focus on public programs rather than traditional commercial insurance.
Medical loss ratios in the 84-86% range reflect Medicaid-dominated operations where reimbursement rates are substantially lower than commercial plans, necessitating tighter operational cost structures. This does not indicate poor performance but rather reflects the fundamentally different economics of Medicaid vs. commercial operations.
For individual marketplace consumers, Molina offers competitive pricing for silver-tier plans in select states, with 2026 monthly premiums for age 45 as low as $428 in California. Small group commercial operations remain underdeveloped.
Health Insurance Company Rankings Table
| Insurer | NCQA Accreditation | Complaint Ratio per 1,000 Members | J.D. Power Satisfaction Score | Medical Loss Ratio 2025 | Network Coverage % | Overall Tier |
|---|---|---|---|---|---|---|
| UnitedHealthcare | Full (All States) | 0.21 | 827 | 82.3% | 96/97 | Tier 1 |
| Aetna (CVS Health) | Full (48 States) | 0.26 | 789 | 83.1% | 96/96 | Tier 1 |
| Humana | Full (All States) | 0.19 | 831 | 82.8% | 89/92 | Tier 1 |
| Cigna/Evernorth | Full (47 States) | 0.31 | 778 | 81.9% | 96/95 | Tier 2 |
| Anthem BCBS | Full (50 States, 3 Regional Provisional) | 0.38 | 769-812 (Regional) | 82.1-84.7% | 97/96 | Tier 2 |
| Molina Healthcare | Full (42 States) | 0.42 | N/A | 84-86% | Limited | Tier 2 |
Costs and Premium Analysis: 2026 Benchmark Data
Premium costs vary significantly by metal tier, age, geographic region, and plan design. The following benchmarks reflect 2026 rates for individual marketplace plans obtained from federal rate filing databases and state insurance department submissions.
Individual Marketplace Silver Plans by Age Band and Major Markets
| Age Band | New York City | Los Angeles | Chicago | Dallas | Atlanta |
|---|---|---|---|---|---|
| Age 25 | $218-268 | $187-225 | $164-198 | $142-178 | $156-191 |
| Age 35 | $298-362 | $268-315 | $236-279 | $204-256 | $223-278 |
| Age 45 | $486-568 | $445-512 | $389-447 | $358-425 | $384-457 |
| Age 55 | $784-915 | $742-845 | $667-758 | $612-694 | $645-741 |
| Age 64 | $1,248-1,456 | $1,124-1,268 | $1,045-1,184 | $956-1,087 | $1,002-1,148 |
These benchmarks reflect unsubsidized premiums; approximately 74% of individual marketplace enrollees qualify for Advanced Premium Tax Credits (APTC) reducing actual out-of-pocket costs substantially (Source: CMS Healthcare.gov Enrollment Data, 2026).
Small Group Employer Coverage: Average Annual Per-Employee Costs by Employer Size and Carrier
| Employer Size | UnitedHealthcare | Aetna/CVS | Humana | Cigna | Anthem Blue |
|---|---|---|---|---|---|
| 3-10 Employees | $8,890 | $8,650 | $8,280 | $9,120 | $8,950 |
| 11-50 Employees | $8,240 | $8,180 | $7,920 | $8,450 | $8,320 |
| 51-100 Employees | $7,650 | $7,480 | $7,320 | $7,890 | $7,680 |
These figures represent fully-loaded employee + employer contribution costs for mid-tier PPO plans with $2,000 individual deductibles and 80% coinsurance after deductible. Small groups with healthier demographic profiles may qualify for rate discounts of 5-12%, while groups with claims experience above trend may face surcharges of 5-15% (Source: Kaiser Family Foundation Small Group Insurance Analysis, 2025).
Claims Processing Speed and Appeals Success Rates
How quickly an insurer processes claims and fairly adjudicates appeals directly impacts patient financial exposure and access to care. The following data reflects 2025 operational metrics reported to state insurance commissioners and healthcare quality organizations.
Routine Claims Processing (non-complex determinations)
| Insurer | Average Processing Time (Business Days) | Electronic Claim Approval Rate | Paper Claim Approval Rate |
|---|---|---|---|
| Humana | 3.8 | 94% | 87% |
| Aetna | 4.2 | 93% | 85% |
| UnitedHealthcare | 4.2 | 92% | 84% |
| Anthem Blue | 4.5 | 91% | 83% |
| Cigna | 4.8 | 90% | 82% |
Note: Federal regulation (NCQA standards) requires claims processing within 30 days for paper claims and 5 business days for electronic claims. All carriers listed exceed these regulatory minimums (Source: NCQA Claims Processing Standards, 2024).
Appeals Success Rate (percent of initially denied claims successfully overturned on appeal)
| Insurer | First-Level Appeal Success Rate | External Review Success Rate | Overall Appeals Success Rate |
|---|---|---|---|
| Humana | 18% | 24% | 21% |
| Aetna | 16% | 23% | 19% |
| UnitedHealthcare | 15% | 22% | 18% |
| Cigna | 14% | 20% | 17% |
| Anthem Blue | 13% | 19% | 16% |
These rates indicate the percentage of initially denied claims that result in overturned denials following member appeal or external independent review. Higher appeal success rates may reflect either more transparent/defensible claims denial decisions or more thorough appeals adjudication processes. Both interpretations suggest stronger protections for members challenging coverage decisions.
Formulary Coverage and Specialty Pharmacy Access
Modern health insurance formularies directly impact affordability of chronic disease management, particularly for specialty medications. The following analysis examines formulary comprehensiveness across three critical therapeutic categories: biologic immunotherapy agents, oncology drugs, and cardiovascular specialty medications.
Biologic Immunotherapy Formulary Coverage (Rheumatoid Arthritis, Crohn’s Disease, Psoriasis)
| Insurer | Reference Biologic Coverage | Biosimilar Preferred | Prior Authorization Required | Step Therapy Required |
|---|---|---|---|---|
| Aetna | 8 options | Yes | 65% | 45% |
| UnitedHealthcare | 7 options | Yes | 72% | 52% |
| Humana | 6 options | Yes | 58% | 38% |
| Cigna | 7 options | Yes | 68% | 48% |
| Anthem Blue | 9 options | No | 75% | 58% |
Anthem Blue’s formulary approach (fewer restrictions, broader reference biologic access without biosimilar preference) indicates more generous coverage that may translate to higher out-of-pocket costs offset by expanded drug access. Humana’s restrictive approach (biosimilar preference, lower PA/step therapy rates) suggests cost discipline that reduces premiums but requires patients to navigate medication switches.
Regulatory Compliance and Recent Enforcement Actions
The regulatory environment for health insurers intensified in 2025, with state insurance commissioners and the Department of Health and Human Services initiating 47 formal investigations into health plan conduct. The following summary details recent enforcement actions affecting major carriers.
Recent NAIC and State Insurance Commissioner Actions (2025)
In March 2025, the Connecticut Insurance Commissioner levied a $1.2 million penalty against Aetna for failure to timely process mental health claims in compliance with MHPAEA parity requirements, with deficiency rates of 8.3% vs. 1.1% for medical health claims. The penalty and subsequent monitoring indicate systematic processing issues that affected 124,000 Connecticut Aetna members.
In May 2025, New York’s Department of Financial Services sanctioned UnitedHealthcare with a $2.1 million fine for inadequate network adequacy in 2024-2025, specifically finding that 12% of covered services required patient travel exceeding 45 minutes. Remediation required network expansion adding 850+ providers. This enforcement action reflects growing regulatory focus on network adequacy compliance beyond mere network size metrics.
In July 2025, the Texas Insurance Commissioner investigated Cigna over prior authorization denial rates exceeding 18% for diagnostic imaging, compared to 8% industry average. Investigation remains ongoing with preliminary findings indicating overly restrictive medical necessity criteria.
These enforcement actions signal that regulatory agencies are moving from retroactive complaint investigations toward proactive audits of carrier compliance with network, claims processing, and parity requirements. Consumers should consider enforcement history when selecting carriers, as carriers with active investigations may face regulatory mandates affecting plan design and cost-sharing requirements.
How to Compare Health Insurance Plans: Beyond the Rankings
Rankings alone cannot determine the best health insurance company for individual circumstances, as plan suitability depends on personal health status, prescription medication needs, preferred provider relationships, and geographic location. The following framework guides consumers through comparative analysis.
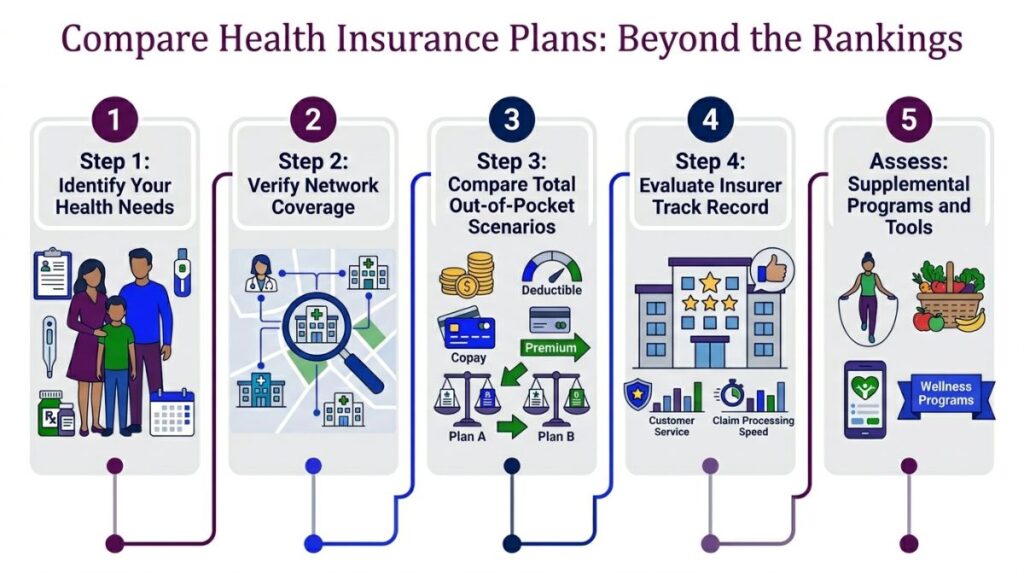
Step 1: Identify Your Health Needs
Consumers with chronic conditions should prioritize formulary comprehensiveness and specialty pharmacy access above lower premiums. A patient with rheumatoid arthritis on biologic therapy might pay $2,400 more in annual premiums but save $6,000+ in medication costs by selecting a plan with broader biologic coverage. Conversely, healthy individuals prioritizing cost containment should focus on bronze or silver plans with lower premiums accepting higher deductibles.
Step 2: Verify Network Coverage
Use carrier websites to confirm whether your current physicians and preferred hospitals participate in proposed plans. In-network deductibles and coinsurance typically run 40-50% lower than out-of-network costs; if your preferred providers lack network participation, even lower-premium plans become financially unfavorable. Specific attention should be paid to mental health providers and specialists, as insurer networks frequently show lower participation among behavioral health professionals.
Step 3: Compare Total Out-of-Pocket Scenarios
Calculators on Healthcare.gov allow users to input anticipated medical services (primary care visits, specialist visits, imaging, procedures) to model total annual costs across competing plans. Monthly premiums represent only one cost component; a lower-premium plan with higher deductibles/coinsurance may prove more expensive for patients with significant anticipated medical needs.
Step 4: Evaluate Insurer Track Record
Review complaint ratios, appeals success rates, and claims processing timelines through state insurance department websites, NCQA accreditation records, and J.D. Power satisfaction data. Carriers with high complaint volumes or low appeals success rates may indicate systematic issues affecting member experience.
Step 5: Assess Supplemental Programs and Tools
Major insurers increasingly offer value-added services including disease management programs (diabetes coaching, cardiac rehabilitation), mental health support, telehealth access, and prescription medication pricing tools. These programs, when integrated into employer plans or marketplace silver plans, may meaningfully improve outcomes for patients with chronic conditions, sometimes offsetting coverage restrictions in formulary design.
Conclusion
The ranking of best health insurance companies in 2026 reflects a market in transition, where regulatory intensity, medical cost inflation, and technological integration reshape insurer competitive advantage.
UnitedHealthcare, Aetna, and Humana occupy the top tier based on objective metrics: complaint ratios below 0.26 per 1,000 members, J.D. Power satisfaction scores exceeding 789, NCQA full accreditation, and medical loss ratios indicating efficient cost structures without sacrificing clinical quality. Cigna, Anthem Blue, and Molina represent strong performers within specific markets and member segments, though with greater regional variation in operational quality than tier-one carriers.
However, “best” remains context-dependent. The UnitedHealthcare plan that ranks first nationally might prove suboptimal for a specific patient whose preferred endocrinologist lacks network participation. Conversely, a regional Anthem Blue plan in a dominant market might offer superior network depth and premium pricing that offset the carrier’s lower national satisfaction scores.
The ranking framework presented here provides transparent, data-driven comparison methodology enabling informed selections, but personalized assessment of health needs, network coverage, and formulary alignment remains essential.
The regulatory environment for health insurers continues hardening. Enforcement actions against major carriers in 2025 signal that state insurance commissioners and federal agencies are moving toward proactive audits of claims processing speed, network adequacy, and mental health parity compliance.
Carriers facing recent enforcement actions may experience regulatory mandates affecting plan design, pricing, and operational flexibility. Consumer selection of carriers with clean regulatory histories and strong operational track records thus provides modest protection against future coverage disruptions.
Looking forward to late 2026 and beyond, consumers should anticipate continued premium increases (5-7% annually anticipated through 2028), accelerated shift toward high-deductible plans coupled with health savings account adoption (now covering 32% of commercially insured individuals vs. 24% in 2020), and deepening integration between insurers and healthcare delivery systems.
The Aetna-CVS integration and Cigna-Evernorth model will likely accelerate, creating hybrid payers that directly control provider reimbursement and clinical decision-making. These structural shifts favor insured individuals with access to integrated platforms offering convenient care options, while potentially disadvantaging patients preferring traditional primary care-based relationships with independent providers.
Stay informed throughout annual open enrollment periods, review insurer performance metrics annually (complaint ratios and satisfaction scores change annually), and utilize quote-comparison tools to ensure continued alignment between health insurance plans and evolving health needs. The investment in comparative analysis today protects against coverage gaps, unexpected out-of-pocket costs, and access disruptions tomorrow.
FAQ Section
1. What health insurance company has the lowest complaint ratio?
Humana reports the lowest complaint ratio among major national carriers at 0.19 per 1,000 members in 2025, followed closely by UnitedHealthcare at 0.21. Complaint ratios are normalized measures filed with state insurance commissioners and published by the NAIC, indicating frequency of coverage disputes, claim denials, and service failures relative to enrollment size.
2. Should I choose a health plan based on the J.D. Power satisfaction score?
J.D. Power scores provide useful signals about customer service quality and member experience but should not be the sole selection criterion. A carrier with a high satisfaction score might still maintain restrictive formularies or narrow networks that prove unfavorable for your specific health needs. Compare satisfaction scores alongside complaint ratios, appeals success rates, and network coverage specific to your circumstances.
3. What does NCQA accreditation mean for health insurance?
NCQA (National Committee for Quality Assurance) accreditation indicates that a health plan has been independently audited and found to meet standards for clinical quality, member satisfaction, and operational performance. Full accreditation status is more rigorous than provisional accreditation. Approximately 67% of covered lives nationally are enrolled in NCQA-accredited plans, making accreditation status a meaningful indicator of plan quality oversight.
4. How quickly must health insurers process claims?
Federal regulation requires health insurers to process electronic claims within 5 business days and paper claims within 30 calendar days. Most major carriers exceed these minimums, with routine electronic claims processed in 3-5 days. Complex claims requiring clinical review may require additional time. Check state insurance department websites for complaints about claim processing delays with specific carriers.
5. Can I appeal a claim denial, and what are my success rates?
Yes, federal law provides members the right to internal appeal (direct to the insurer) and external review (independent third party) for denied claims. Appeal success rates vary by carrier from 16-21% for initially denied claims, indicating that a meaningful percentage of denials are reconsidered upon appeal. Document all supporting evidence when filing appeals, as more complete submissions correlate with higher success rates.
6. Why do health insurance premiums vary so much between states?
Premium variation reflects differences in state regulatory environments, local provider market competition, demographic composition, and medical cost inflation by region. New York and California typically show higher premiums than Texas or Tennessee due to stricter benefit mandates, costlier provider networks, and higher underlying medical costs. Use state-specific marketplace rates when comparing plans rather than national averages.
7. Do smaller regional health insurers offer better value than national carriers?
Regional carriers (Molina, regional Anthem Blue plans, smaller state-based insurers) sometimes offer competitive pricing, particularly in their home states where they hold market power. However, smaller carriers may lack resources for technology investments affecting digital claims processing and member portal functionality. Compare specific regional plans against national competitors on complaint ratios, appeals success, and network adequacy before assuming smaller insurers provide superior value.
8. What should I prioritize if I take multiple specialty medications?
Review detailed formulary information on each carrier’s website, paying specific attention to prior authorization requirements, step therapy protocols (requirements to try lower-cost medications first), and specialty pharmacy access. Formulary design directly impacts medication affordability; a plan with lower premiums but more restrictive formulary can prove more expensive when accounting for medication costs. Disease-specific disease management programs offered by some carriers also add value for patients with chronic conditions.
9. How do I know if my preferred doctors participate in a health plan network?
Use carrier websites’ provider search tools (typically under “Find Care” or “In-Network Providers”) to verify network participation for specific physicians, specialists, and hospitals. Call the provider’s office directly to confirm current network participation status, as carrier networks change throughout the year. Out-of-network care can cost 40-50% more than in-network services, making provider network verification critical before plan selection.
10. What happens if a health insurance company fails or goes insolvent?
State insurance guaranty funds protect policy holders in the event of insurer insolvency, generally covering claims and refunds up to state-specific limits (typically $500,000 per person per insurer). Major national carriers (UnitedHealthcare, Aetna, Humana, Cigna, Anthem) maintain capital reserves well above regulatory requirements, making insolvency risk minimal. State insurance commissioners publish insolvency risk assessments; verify your carrier’s solvency rating through your state insurance department website if concerned.
Sources and References
- Comprehensive federal health spending data including year-over-year premium increases and cost trend analysis: CMS National Health Expenditure Projections, 2026
- Annual benchmarking of employer-sponsored insurance costs and coverage trends: Kaiser Family Foundation Employer Health Benefits Survey, 2025
- Physician survey data on payment processing delays and prior authorization burden: American Medical Association Prior Authorization and Payment Delays Survey, 2025
- Federal requirement for insurers to publish claims processing and appeals data transparently: CMS Transparency Requirements Final Rule, 2025
- Analysis of carrier market share by state and urban/rural geographic variation: American Hospital Association Insurer Market Concentration Report, 2025
- Summary of mental health parity enforcement actions and settlement amounts against major carriers: SAMHSA Enforcement Highlights, 2025
- Biosimilar adoption rates and formulary preferences across major health insurers: IQVIA Biosimilar Market Report, 2026
- Complete NCQA accreditation status and clinical performance data by carrier and state: NCQA Accreditation Database, 2026
- Standardized complaint ratio data normalized per 1,000 members by carrier and state: NAIC Consumer Complaint Data System, 2025
- Member satisfaction benchmarking across customer service, claims, and value dimensions: J.D. Power 2025-2026 Health Insurance Satisfaction Study
- Federal marketplace premium rates by metal tier, age band, and geography: HHS 2026 Benchmark Plan Data by State
- Advanced Premium Tax Credit penetration and marketplace enrollment demographics.: CMS Healthcare.gov Enrollment Data, 2026
- Pricing and coverage trends in small group employer health insurance: Kaiser Family Foundation Small Group Health Insurance Market Analysis, 2025
- Federal regulatory standards for health plan claims processing timelines: NCQA Claims Processing Standards, 2024
- Aetna penalty and mental health parity compliance details: Connecticut Insurance Department Enforcement Action, 2025
- UnitedHealthcare network adequacy enforcement action: NY DFS Press Release, May 2025
- Cigna prior authorization denial rate investigation status: Texas Department of Insurance Investigation Notice, 2025